The price of Binance coin or BNB (BNB) is gaining momentum as it breaks above the moving averages.
BNB price long-term prediction: bullish
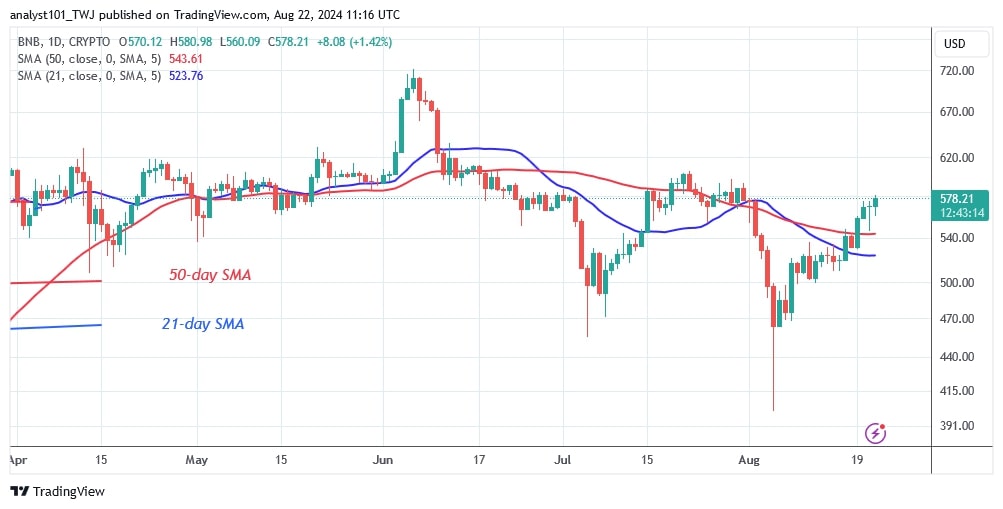
On August 5, the bulls bought the dips and continued the cryptocurrency’s positive trend. The price of the altcoin rose above the moving average and reached a high of $582. The current upward momentum is expected to hit resistance at the high of $600.
Since July 19, buyers have failed to sustain the bullish momentum above $600. Should the buyers overcome the $600 hurdle, the uptrend could rise to $635. However, selling pressure will return if the altcoin falls below $600. BNB is now valued at $582.
BNB indicator reading
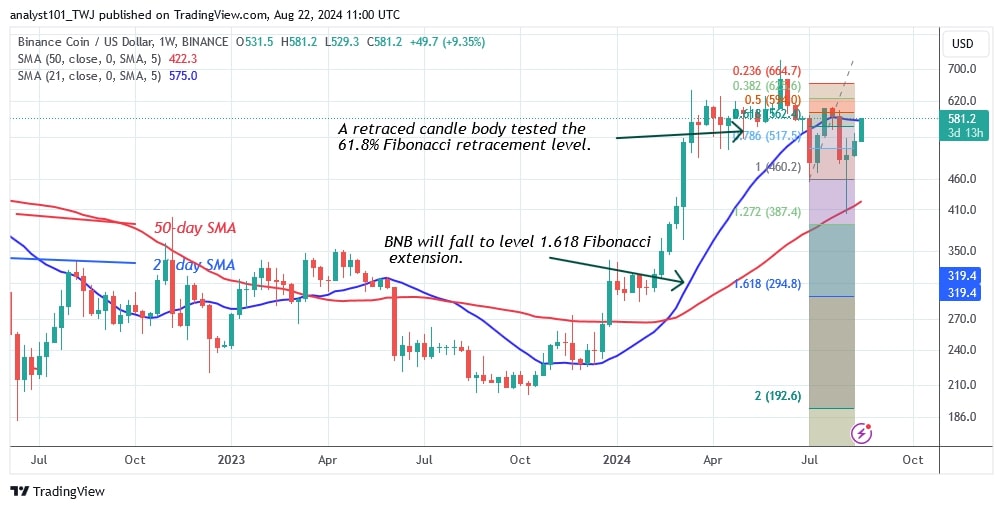
BNB is gaining value as the price bars remain above the moving average lines. On the weekly chart, buyers are trying to push the price above the 21-day SMA resistance. If the price of the cryptocurrency falls below its recent high, it will remain between the moving average lines. The moving average lines are horizontal and indicate a sideways trend.
Technical indicators:
Key Resistance Levels – $600, $650, $700
Key Support Levels – $400, $350, $300

What’s next for BNB/USD?
The price of BNB has recovered and risen above the moving average lines. The price of the cryptocurrency is currently facing a first barrier at a high of $580. If the first barrier is breached, the bullish momentum will continue. Otherwise, the altcoin will trade above the moving averages but below the $600 mark.

BNB has been trading below the moving average lines but above the $470 support over the past week as reported by Coinidol.com.
Disclaimer. This analysis and forecast are the personal opinions of the author. They are not a recommendation to buy or sell cryptocurrency and should not be viewed as an endorsement by CoinIdol.com. Readers should do their research before investing in funds.


