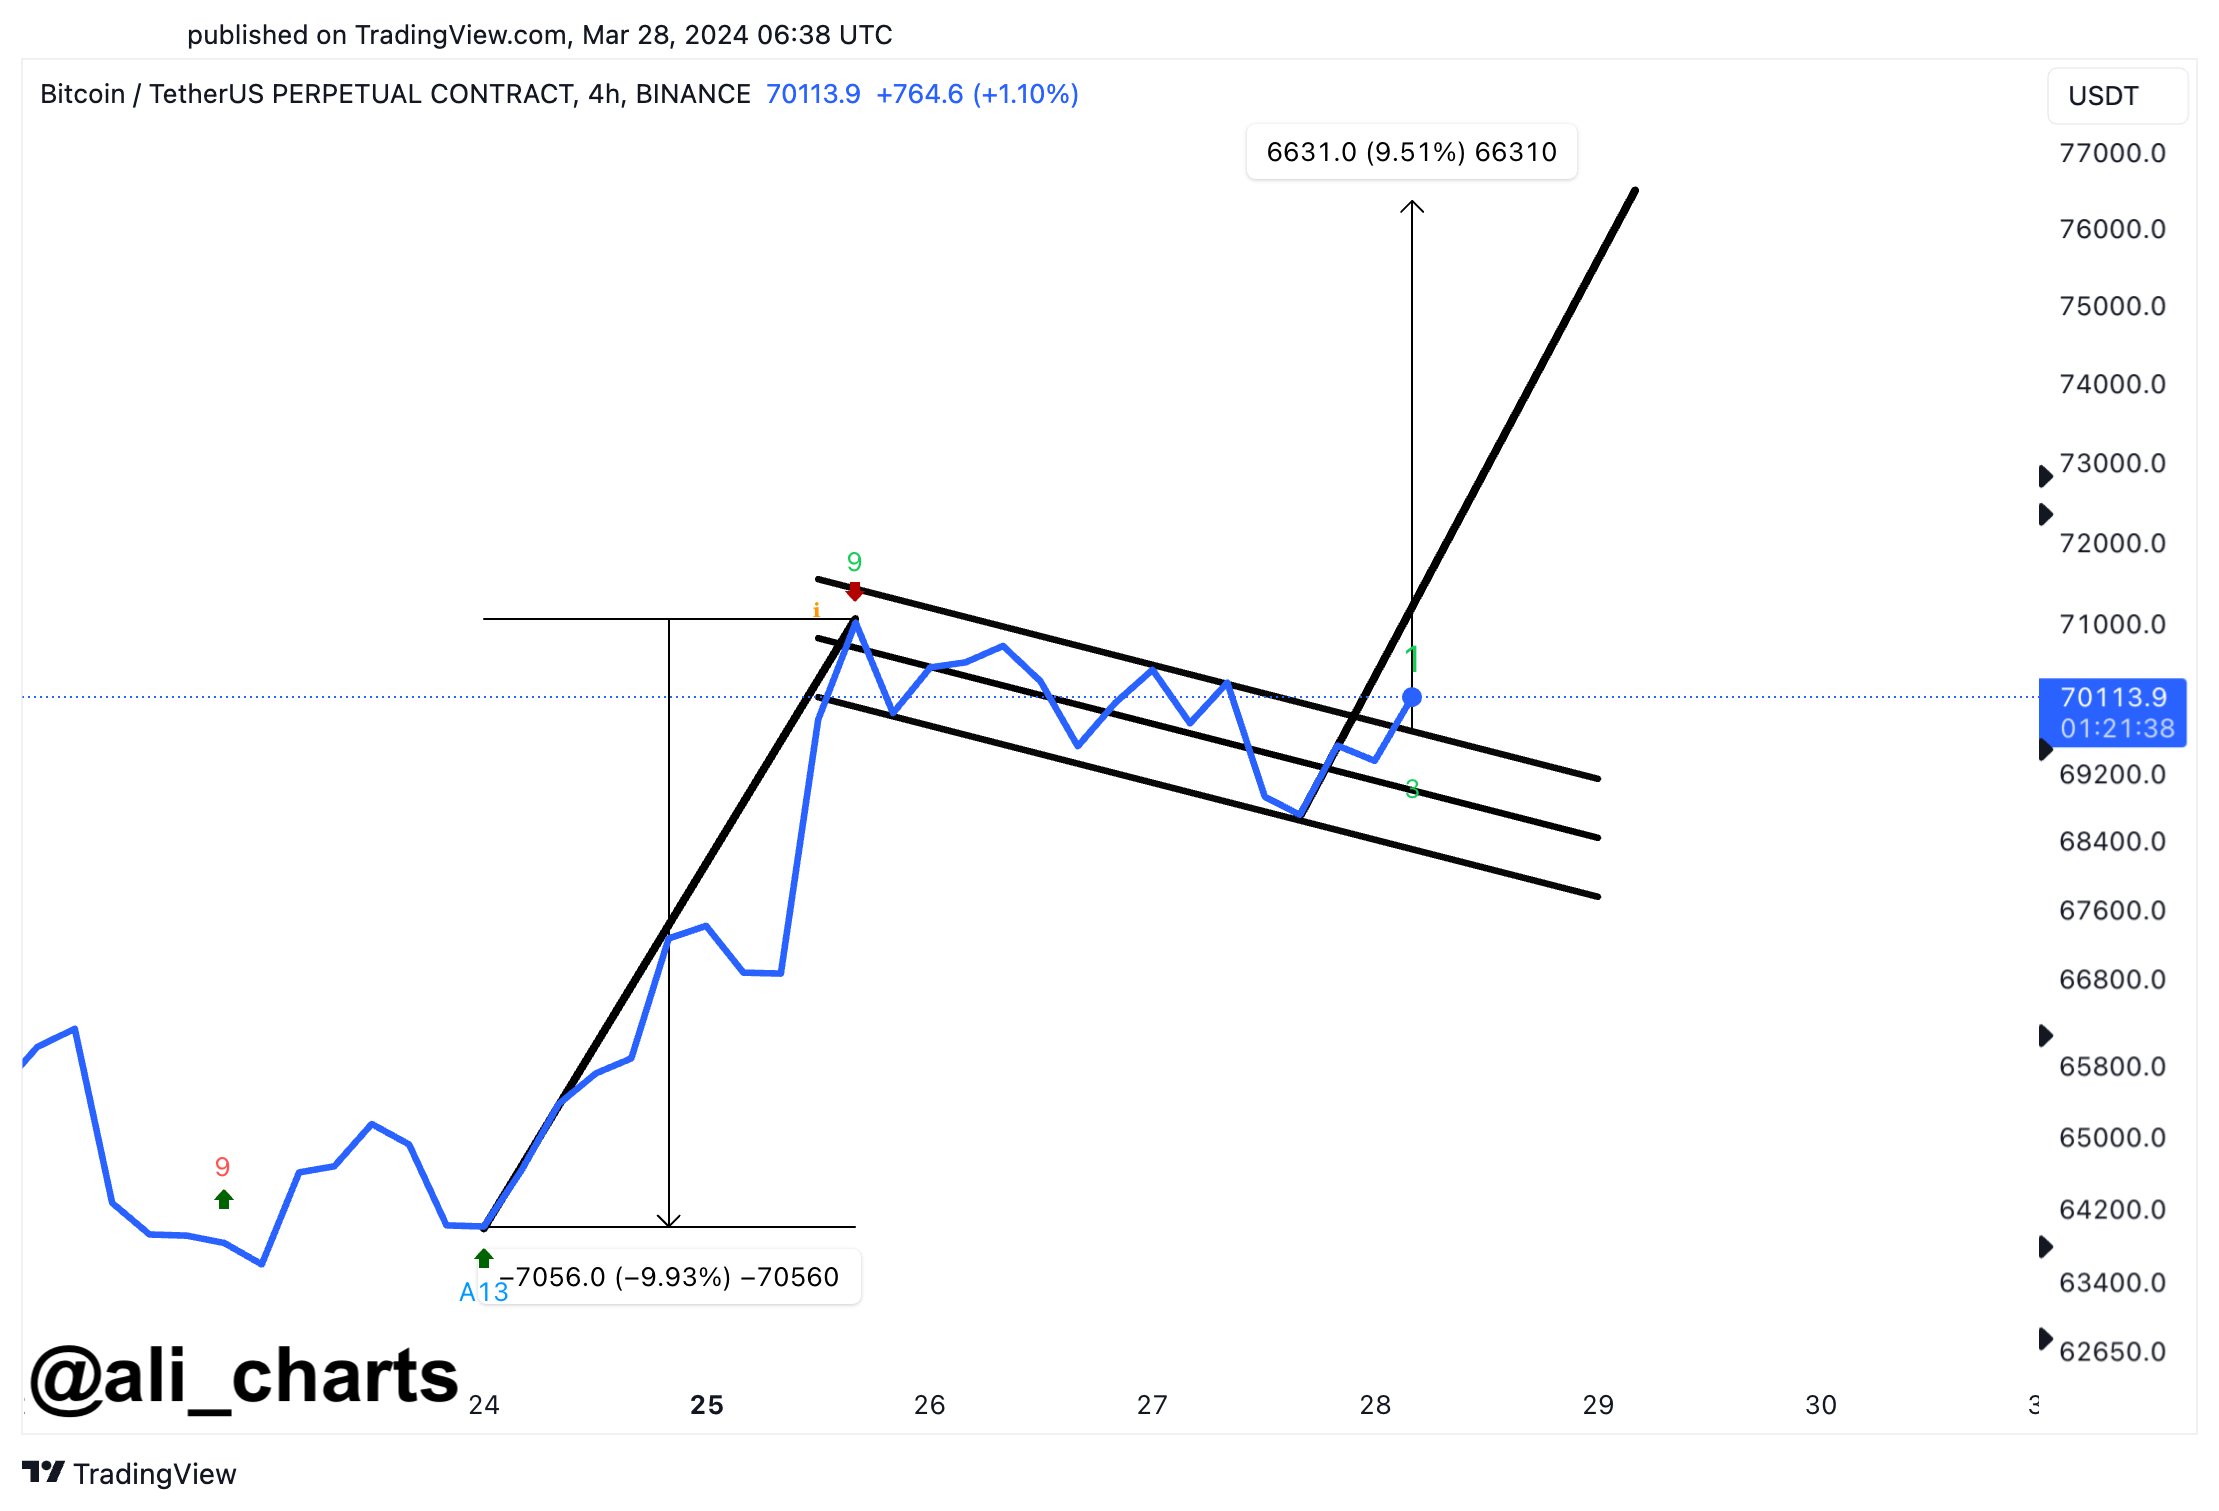
An analyst has explained that a breakout from a bull flag pattern could lead Bitcoin to surging towards a new all-time high of $77,000.
Bitcoin Has Been Forming A Bull Flag Pattern Recently
In a new post on X, analyst Ali has discussed about a bull flag recently forming in the 4-hour price of the cryptocurrency. The “bull flag” here refers to a pattern in technical analysis that, as its name implies, looks like a flag on a pole.
In this pattern, a sharp uptrend is succeeded by a period of consolidation towards the downside. The uptrend makes up for the pole, while the consolidation period acts as the flag.
When the price is trapped inside the flag, it tends to find resistance at its upper line, so tops may be probable to form there. Similarly, the lower line may act as support, thus facilitating for bottoms to take shape.
The bull flag is usually considered to be a continuation pattern, meaning that the prevailing trend (that is, the trend of the flag) would continue once the consolidation period is over.
This happens when a break above the resistance line takes place. The uptrend emerging out of such a break may be of the same height as the pole. If the asset falls under the support line, though, the pattern could be considered invalidated.
Like the bull flag, there is also the bear flag pattern, which works similarly except for the fact that the pole in this case corresponds to a downtrend while the flag is generally a consolidation channel angled upwards. Just like the bull flag, a continuation of the prevailing bearish trend may follow this formation.
Now, here is the chart shared by Ali that shows the bull flag that BTC’s 4-hour price has recently been consolidating inside:
Looks like the price of the asset has been breaking out of this pattern recently | Source: @ali_charts on X
From the graph, it’s visible that the 4-hour Bitcoin price has appeared to have been consolidating inside this bull flag over the last few days. It’s also apparent that, in the past day, BTC has been climbing above the resistance line of the pattern.
This could mean that the cryptocurrency is preparing a break out of this formation. Naturally, the asset would have to show more momentum before the breakout can be confirmed.
“If BTC holds above $70,000, we could see a surge of nearly 10% to a new all-time high of $77,000!” says Ali. The analyst has chosen this target as such a swing would be of the same length as the pole that had preceded this flag.
BTC Price
Bitcoin has so far been heading in a direction that would add more credence to the breakout, as its price has now broken past the $71,300 level. With this surge, BTC investors would be enjoying profits of more than 7% over the past week.
The price of the asset appears to have surged over the past 24 hours | Source: BTCUSD on TradingView
Featured image from Shutterstock.com, charts from TradingView.com
Disclaimer: The article is provided for educational purposes only. It does not represent the opinions of NewsBTC on whether to buy, sell or hold any investments and naturally investing carries risks. You are advised to conduct your own research before making any investment decisions. Use information provided on this website entirely at your own risk.

