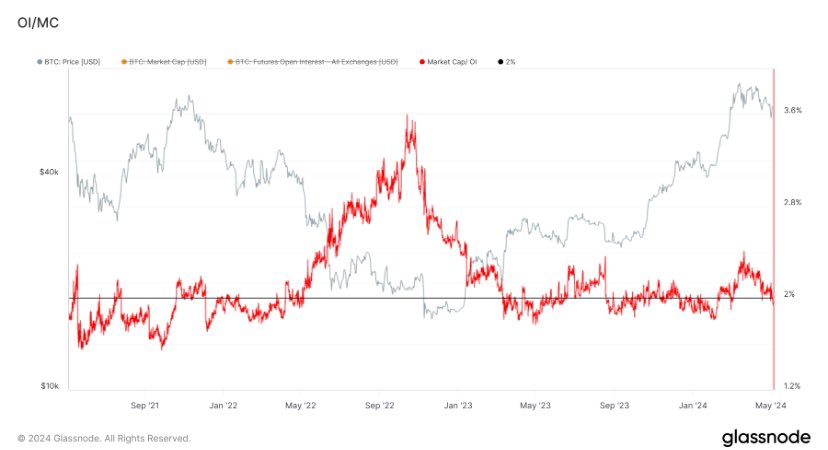
Data shows the Bitcoin Open Interest as a percentage of its market cap has been at lows recently, a sign the derivatives side has been healthy.
Bitcoin Open Interest Is Now Less Than 2% Of The Market Cap
As explained by analyst James Van Straten in a new post on X, the derivatives side of the market has looked “extremely healthy” while BTC’s latest recovery has occurred.
The metric of interest here is the “Open Interest,” which keeps track of the total amount of derivatives-based Bitcoin positions that are currently open on all centralized exchanges.
When the value of this indicator goes up, it means that the investors are opening up more positions on the market right now. Generally, the total leverage in the market rises when such a trend takes place, so the price of the asset could end up turning more volatile following it.
On the other hand, a decline in the metric suggests users are either closing up their positions of their own volition or getting forcibly liquidated by their platform. The cryptocurrency may behave in a more stable manner following such a decrease.
Now, here here is a chart that shows the trend in the Bitcoin Open Interest over the past few years:
The value of the metric seems to have been going down in recent days | Source: @jvs_btc on X
In the graph, the Open Interest is displayed as a percentage of the asset’s market cap (that is, the total valuation of the entire BTC circulating supply at the current spot price).
It would appear that the indicator has registered a drawdown recently and has slipped under the 2% mark. This would suggest that the positions on the derivatives market now make up for less than 2% of the market cap.
From the chart, it’s visible that the metric had earlier spiked to a high as the coin’s rally towards a new all-time high had taken place. Interestingly, the market cap was rapidly going up in this rally, but this ratio was still trending up, implying that speculation had been growing at a rate faster than the price.
This may have been a sign that the derivatives side was starting to become overheated. In the drawdown that had followed the price top, the investors had started getting liquidated, leading to the ratio registering a decline.
The most recent price drop had helped reset the market further, bringing the ratio down to levels not seen since February. Bitcoin has been mounting a recovery effort in the past few days, but so far, the derivatives market has remained cool. “Hard to be bearish here,” says the analyst.
It now remains to be seen if the health of the market would continue to look optimistic in the coming days, thus potentially allowing for the recovery to go a step further.
BTC Price
Bitcoin had returned back above $65,500 earlier, but the asset has since seen a small pullback as it’s now down to $64,100.
Looks like the price of the asset has been heading up over the last few days | Source: BTCUSD on TradingView
Featured image from André François McKenzie on Unsplash.com, Glassnode.com, chart from TradingView.com
Disclaimer: The article is provided for educational purposes only. It does not represent the opinions of NewsBTC on whether to buy, sell or hold any investments and naturally investing carries risks. You are advised to conduct your own research before making any investment decisions. Use information provided on this website entirely at your own risk.

