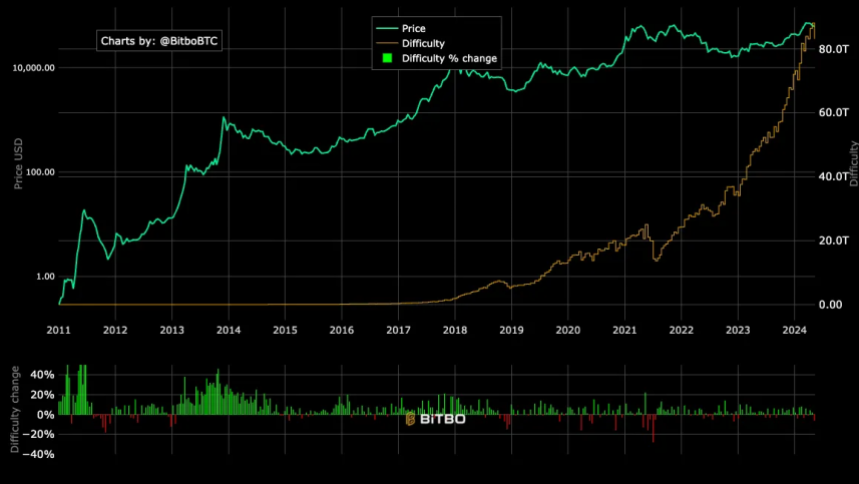
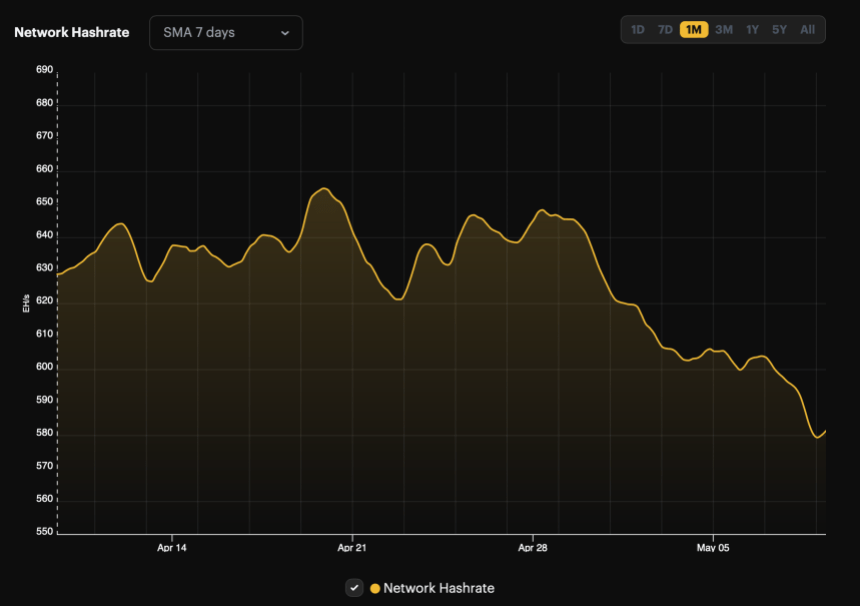
The Bitcoin mining difficulty has experienced a significant decrease, the largest drop observed in the last 18 months. This change is directly tied to fluctuations in the network’s hash rate, which has dipped below 600 EH/s following the recent halving event.
The adjustment, which marks a 5.7% fall in mining difficulty, brings the level down to 83.1 trillion, according to data from Bitbo.

This most substantial adjustment since December 2022 reflects broader shifts within the Bitcoin mining landscape. At that time, Bitcoin’s price hovered around $17,000, contrasting sharply with current levels.
Notably, the mining difficulty, a metric that determines how challenging it is to find a new block, adjusts approximately every two weeks, or every 2016 blocks. This system ensures that block discovery remains consistent at around every 10 minutes, irrespective of the number of miners.
Related Reading
Impact On Miners And Market Dynamics
The recent decline in mining difficulty came after a 10% drop in the network’s hash rate from a seven-day moving average of 639.58 EH/s to 581.74 EH/s.

This decrease in hash rate led to longer average block times of about 10 minutes and 36 seconds, up from the standard 10 minutes, before the difficulty adjusted downward at block height 842,688.
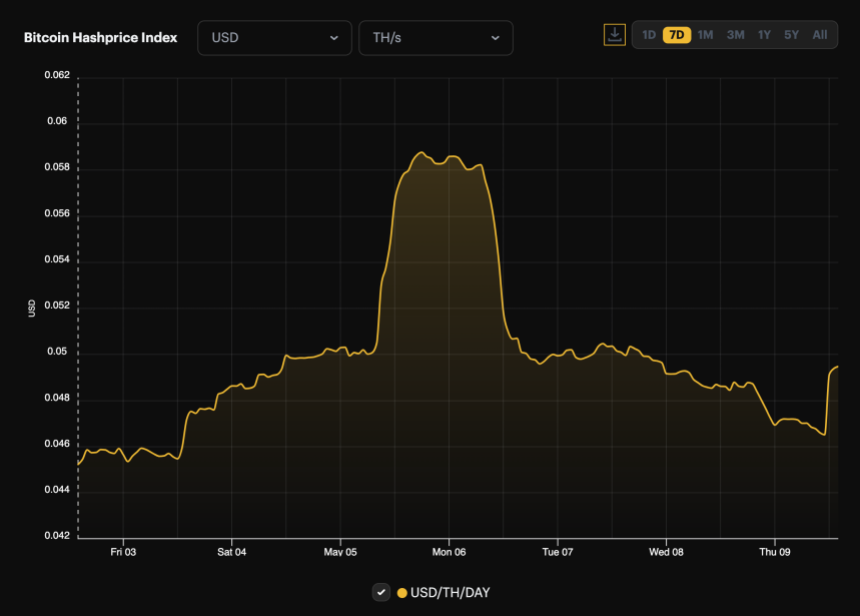
The reduced hash rate also contributed to a new low in the hash price, which fell to roughly $0.049 per TH/s per day.

This decline impacts miners’ profitability, as the hash price, a term introduced by Bitcoin mining firm Luxor, represents the earnings a miner can expect per unit of hashing power per day.
However, today’s negative difficulty adjustment may provide some relief for miners, making it easier to mine blocks than in the previous two weeks.
Bitcoin Market Reactions And Investment Trends
The adjustments in mining difficulty and hash rate come when Bitcoin’s price also shows signs of volatility. After reaching a peak above $73,000 in March, the price has fallen by 16% and is now trading around $61,376.
This decline mirrors the broader trend in the mining difficulty, suggesting a possible correlation between these metrics.
Related Reading
Furthermore, the market has observed subdued activity in the spot Bitcoin exchange-traded funds (ETFs). Data from Soso Value indicates minimal net inflows or outflows, with Bitwise Bitcoin ETF being the only issuer that experienced inflows yesterday.
On May 8, the total net inflow of Bitcoin spot ETF was $11.5409 million. Grayscale ETF GBTC has no inflows and outflows. Bitwise ETF BITB saw a single-day net inflow of $11.5409 million. The total net asset value of Bitcoin spot ETFs is $51.504 billion. https://t.co/OkjFkXsACa
— Wu Blockchain (@WuBlockchain) May 9, 2024
This trend could signify a cooling interest in Bitcoin investments or a shift in investor strategy following the recent price and mining adjustments.
Feature image from Unsplash, Chart from TradingView

