The Solana network’s native cryptocurrency, SOL, has been on an upward surge in the past three days, climbing from around $180 to over $210.
Having failed to break its previous low of $162.74, the coin, which is currently ranked 5th in the crypto market with a total supply of 441 million and a market capitalization of over $88 billion, SOL is showing no signs of stopping.
Will Solana Continue To Surge Upward?
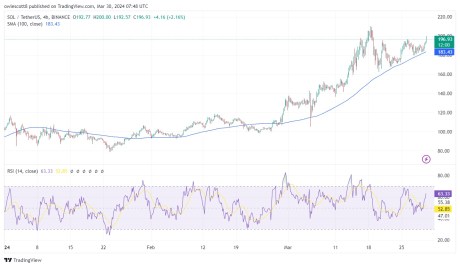
At the time of writing, Solana has been up by 6.25% trading around $198 in the past 24 hours, and has broken above the previous resistance level of $195. The price is also trading above the 100-day moving average on the 4-hour chart of the SOL/USD pair. If the price continues to move upward, it might break above its major resistance level of $210 and move even higher to create a new high for the year.
All these can be seen in the image below:

Looking at the chart with the help of the RSI (Relative Strength Index) indicator in the image above, we can see that the RSI line is trending above the 50 level. This is an indication that the price of SOL is still in a bullish zone and could even surge further upward.
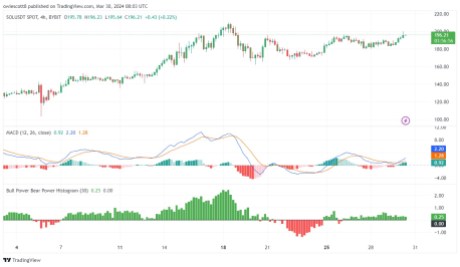
A further look at the 4-hour timeframe chart with the help of the MACD indicator, we can see that the MACD is on the bullish side as the MACD line, the signal line, and the MACD histogram are all trending above the zero line.
Finally, using the bull vs bear power histogram indicator, it appears buyers have taken over the market with powerful momentum and are ready to push the price even higher.
We can confirm this in the image below:

With the momentum that Solana is moving with, there is a possibility that it could break above its previous resistance level of $210.27. If this manages to happen we could see prices soaring higher especially with the level of demand momentum in the market
Could SOL Dip?
If the price of Solana fails to break above the resistance level of $210, it could start a downside correction to its initial support level of 162. If the price closes below this support level, it could decline even further and probably start a downward trend.
Featured image from YouTube, chart from Tradingview.com
Disclaimer: The article is provided for educational purposes only. It does not represent the opinions of NewsBTC on whether to buy, sell or hold any investments and naturally investing carries risks. You are advised to conduct your own research before making any investment decisions. Use information provided on this website entirely at your own risk.

