BNB, the native token of the Binance Smart Chain, experienced a drop on Friday, showing a huge red candlestick after opening at around $305 and moving downward toward $297.93.
This downward move began with a rejection at $312.53 on Wednesday, thereby creating resistance at the same level. At the time of writing, the price still shows strong signs of moving downward to its previous support level of $300.
If this support level is unable to hold, then the price might continue downward to the next support level at $263.93. But, if the support does hold, we might see the price bounce back and move upward to create a new high for the year. However, the price is still above the 100-day moving average, which is usually a bullish sign for the price.
Technical Indicators Point Toward Sustained Downtrend For BNB
To figure out where the BNB price might be headed next, several indicators can be used to examine the chart;
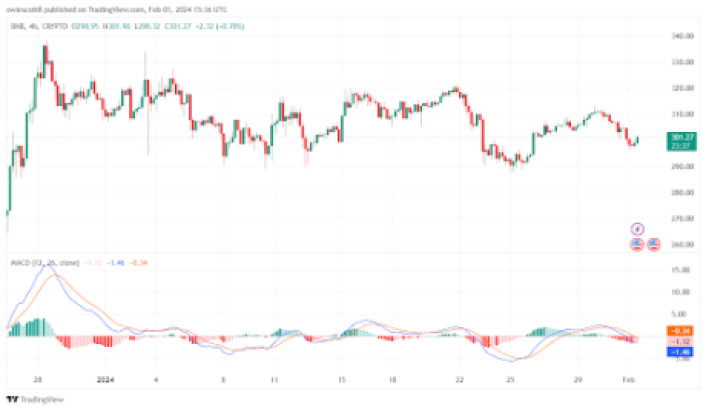
4-Hour MACD: We can see that the histogram is below the zero line, thereby suggesting a downward trend.

SOURCE: Tradingview
We can also see that the MACD line has crossed below the signal line, pointing toward a sustained bearish trend.
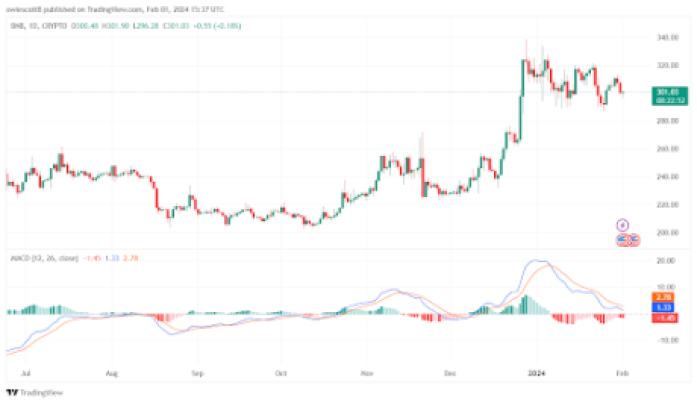
1-Day MACD: From the daily chart, we can confirm that both the MACD line and signal line have crossed and are heading toward the zero line, while the histogram is already below the zero line, indicating further downward movement.

SOURCE: Tradingview
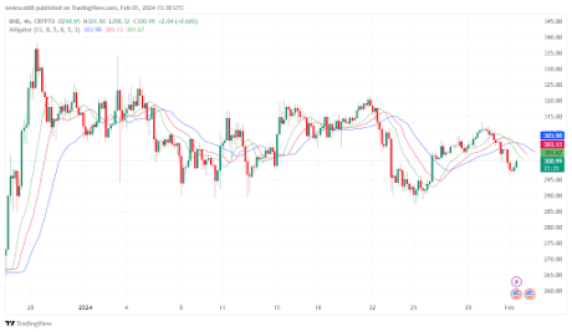
4-Hour Alligator Using the alligator indicator to examine the chart on the 4-hour timeframe, we can see that the jaw, the teeth, and the lips are all facing downward and are separated from each other. This has historically been a bearish signal and suggests further downward momentum.

SOURCE: Tradingview
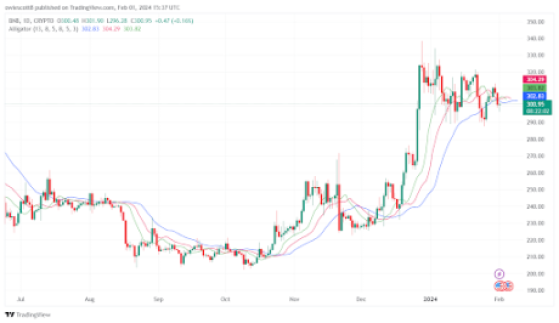
1-Day Alligator: Also, looking at the alligator indicator from the daily chart, it can be seen that the alligator lip [green line] and the teeth [red line] are showing signs of cross over the jaw [blue line], suggesting a downward movement
SOURCE: Tradingview

Final Thoughts
Although the MACD and the Alligator are popular indicators, it should be noted that they are not infallible, and traders frequently combine them with other technical analysis tools to help them make better trading decisions.
Furthermore, false signals can happen, particularly in erratic or sideways markets, so it’s critical to take the larger market context into account.
Token price struggles to hold support at $300 | Source: BNBUSD on Tradingview.com
Featured image from Dall.E, chart from Tradingview.com
Disclaimer: The article is provided for educational purposes only. It does not represent the opinions of NewsBTC on whether to buy, sell or hold any investments and naturally investing carries risks. You are advised to conduct your own research before making any investment decisions. Use information provided on this website entirely at your own risk.

