
- Bitcoin cash is eyeing a fresh increase above the $650 resistance against the US Dollar.
- The price is now trading below the $640 zone and the 55 simple moving average (4 hours).
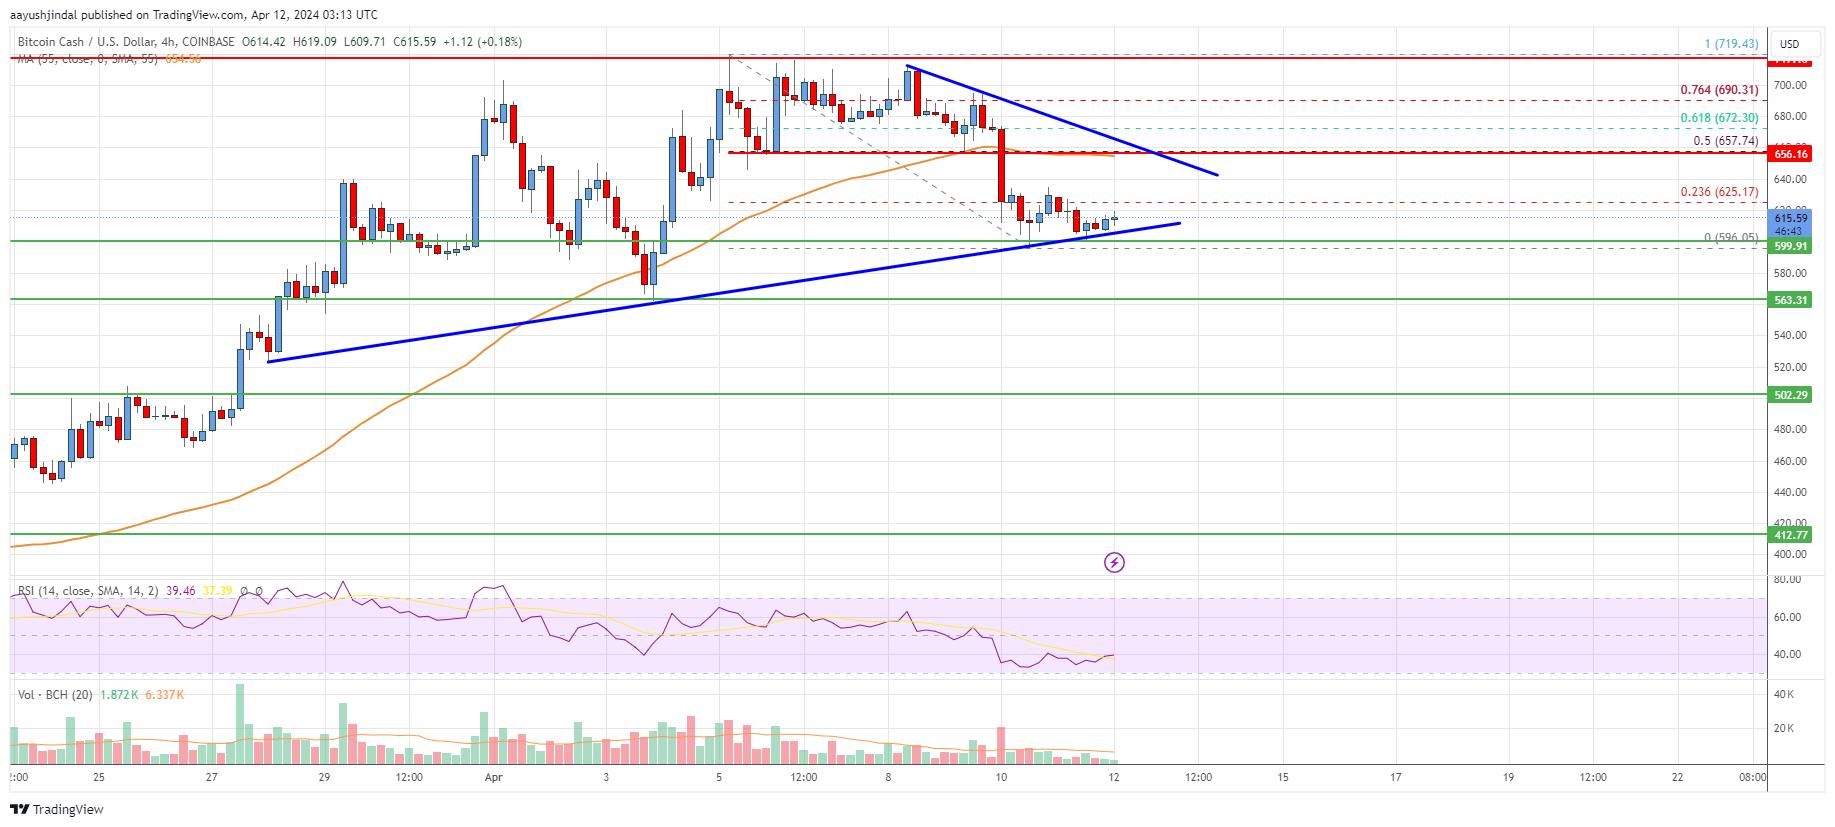
- There is a key contracting triangle forming with resistance at $655 on the 4-hour chart of the BCH/USD pair (data feed from Coinbase).
- The pair must clear $650 and $655 to start a fresh increase in the near term.
Bitcoin cash price is consolidating gains above $600 against the US Dollar, unlike Bitcoin. BCH/USD could start a fresh surge if it clears the $655 level.
Bitcoin Cash Price Analysis
Bitcoin cash price started a pullback from the $720 zone. BCH traded below the $700 and $650 support levels to enter a short-term bearish zone.
A low was formed near $596 before the price found support. The price is now consolidating losses and attempting a fresh increase. There was a move above the $605 level, but the price is still below the 23.6% Fib retracement level of the downward move from the $719 swing high to the $596 low.
Bitcoin cash is now trading below the $650 zone and the 55 simple moving average (4 hours). On the upside, the price is facing resistance near the $625 level.
The first key resistance is near $650 or the 50% Fib retracement level of the downward move from the $719 swing high to the $596 low. There is also a key contracting triangle forming with resistance at $655 on the 4-hour chart of the BCH/USD pair.
The next major resistance is near $670, above which the price may perhaps gain bullish momentum. The next major resistance is near the $700 level. Any more gains above $700 could set the pace for a move toward the $720 level or even $750.
If not, the price might start another decline. Immediate support on the downside is near the $600 level. The first major support sits near the $565 level. The next major support is near $500 below which the bears might aim for $450.
Looking at the chart, Bitcoin Cash’s price is now trading below the $650 zone and the 55 simple moving average (4 hours). Overall, the price must clear $650 and $655 to start a fresh increase in the near term.
Technical indicators
4 hours MACD – The MACD for BCH/USD is losing pace in the bearish zone.
4 hours RSI (Relative Strength Index) – The RSI for BCH/USD is below the 50 level.
Key Support Levels – $600 and $565.
Key Resistance Levels – $625 and $650.